Basic Debugging
It is sometimes useful to be able to find out what is happening to our code as it executes. Fortunately, IDEs typically provide something called a 'debugger' which will allow us run the programme in such a way that it is possible to pause execution of a programme and inspect the contents of variables, without needing to output them to the console.
Starting the debugging process
In IntelliJ IDEA, rather than clicking the using green play button to run the code, we click the adjacent 'green bug' button:
![]()
Pausing execution
In order to tell the programme that we want execution to pause at a specific point we place a 'breakpoint' in the code. Setting a breakpoint is a simple as clicking in the margin next to the code, so that a red circle appears as shown here:
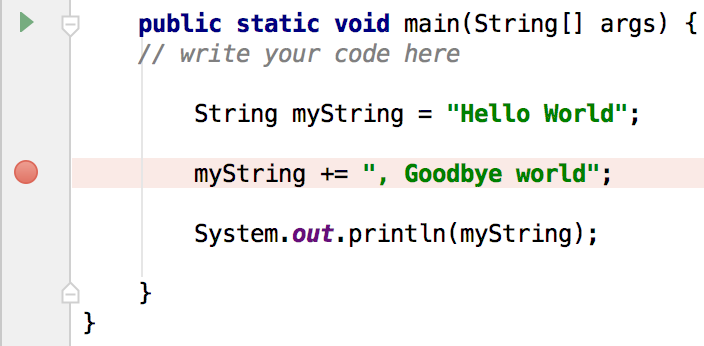 The code will pause executing before the line of code with the breakpoint executes (in common parlance this would be called 'hitting a breakpoint'). Further breakpoints can be set as desired. Breakpoints that are set within a conditional statement will only be hit if the code within the statement would ordinarily execute (thus breakpoints can be useful in determining which code is actually being run).
Inspecting variables
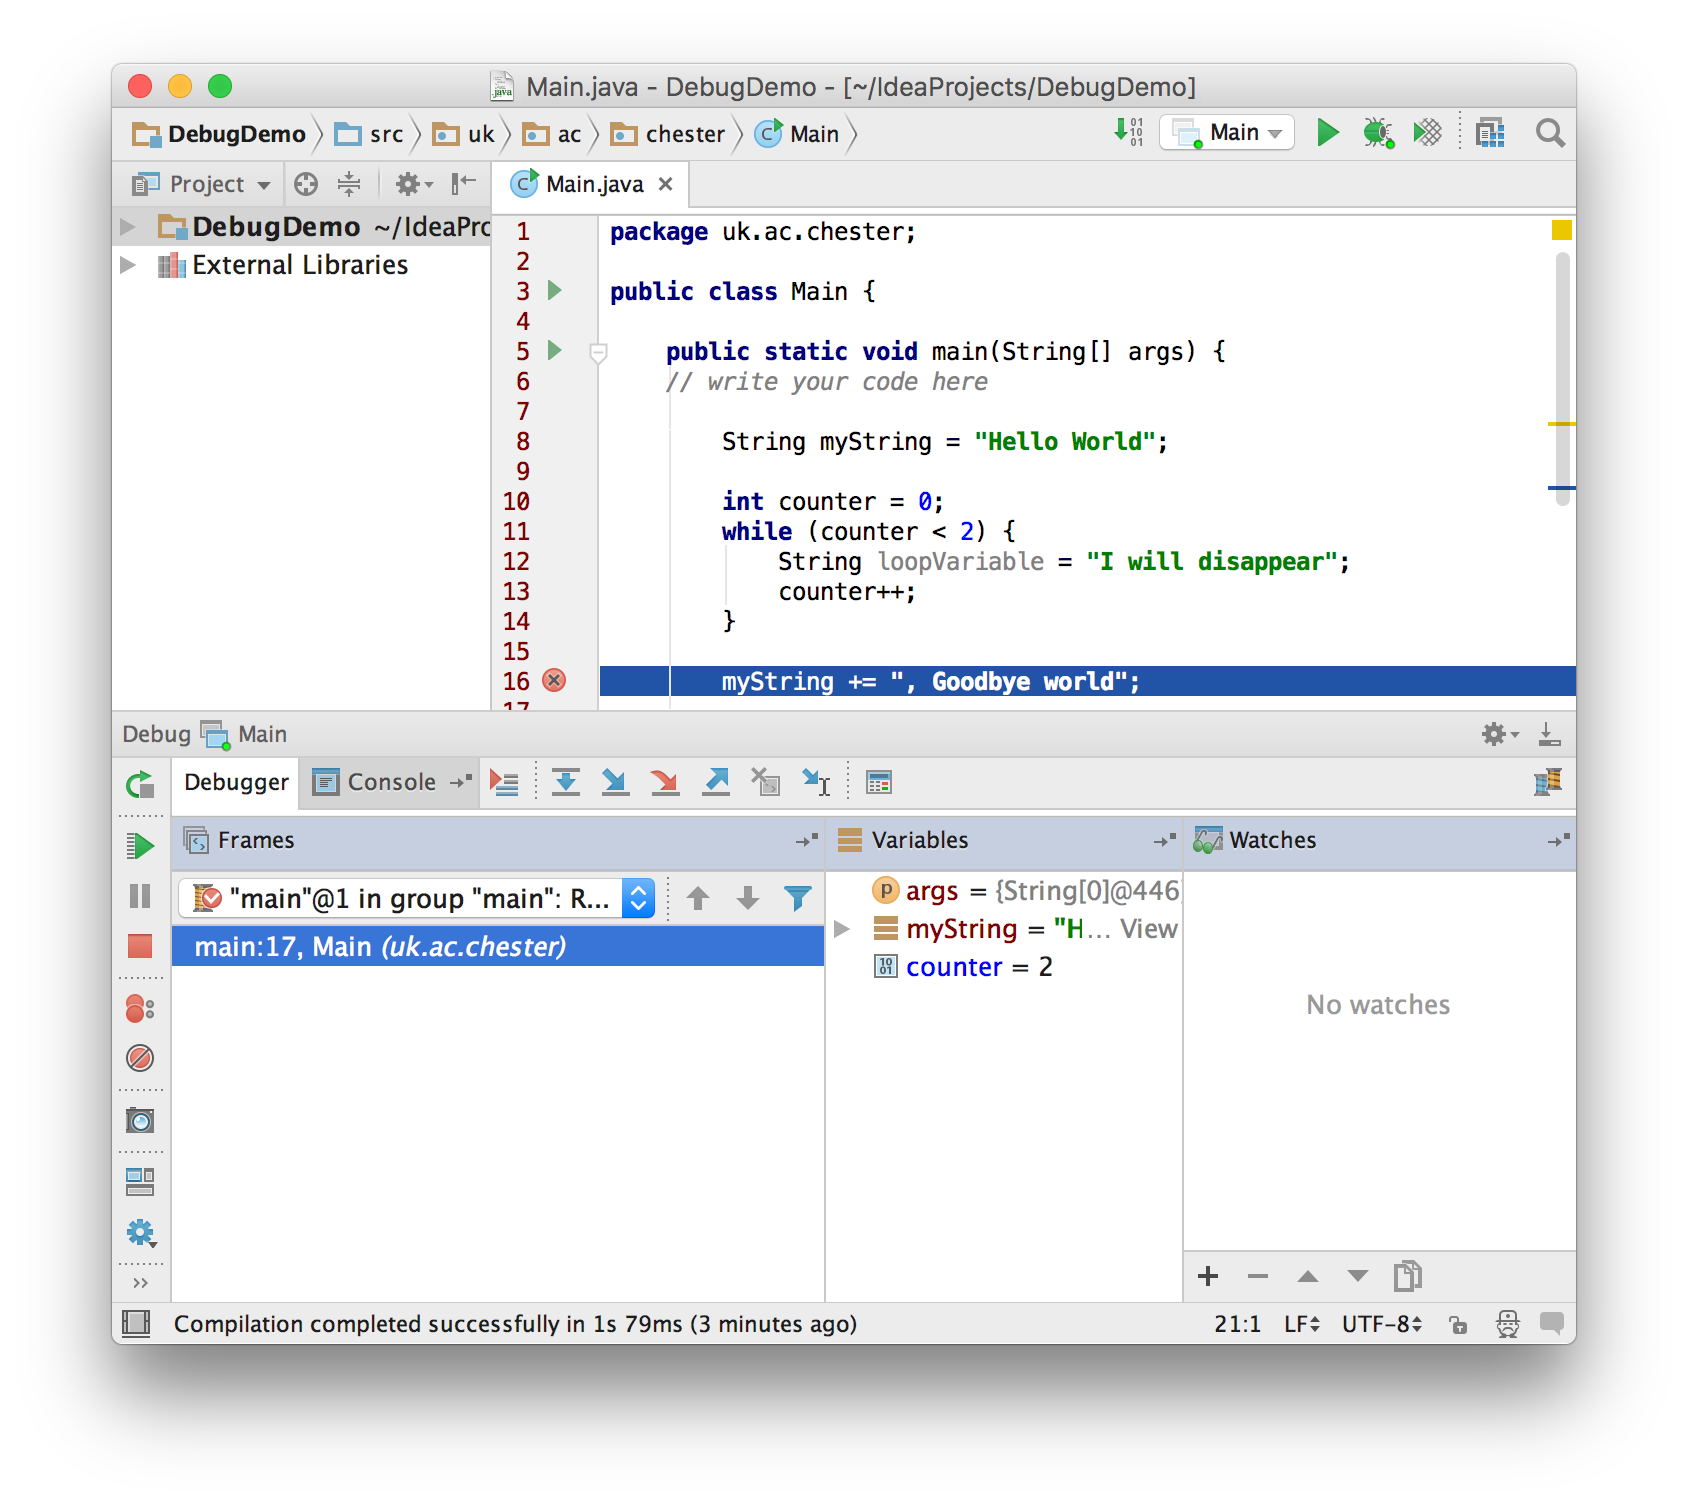
Once the code has paused, the debugger window will show us variables that are in-scope (i.e. variables that are yet to be created, and variables that only existed inside a loop, will not be available). The below example shows a breakpoint that has been hit. Note that counter and myString are visible in the variables windows, but that loopVariable is not. Had we set the breakpoint on line 13, we would have been able to see the value of loopVariable.
 We can also see the value of a variable by hovering the mouse over it.